
Diving into Elasticsearch from the code side is surprisingly straightforward once you get the hang of it. In the inaugural article of this series, we're excited to guide you through establishing a robust three-node cluster and connecting to it securely using self-signed certificates.
Elasticsearch is a very powerful search engine and setting up a stack in a development environment can be a little tricky.
In this article and the following, we will progress step by step through the whole process and have a look at many possiblities.
We will talk about various subjects like requesting, cluster administration or vector search.
All the code displayed here is available on Gitlab. The branch matching this article is this one: 01-dev-elastic.
One of the main characteristics of Elasticsearch is that it can be deployed on a cluster composed of many nodes. It enables several things:
Horizontal scalability
Specialize some nodes according to the needs
Service availability
etc.
Communicating with a cluster is done with the http protocol on port 9200.
In order to remain close to production conditions, we will begin by setting up a three nodes cluster, with no specific role.
we will also set up a Kibana so that we can manage the cluster, request or visualize data.
In order to securize communications with the cluster, we will use TLS and self-signed certificates.
Because using unsecured communications in a production environment would be unthinkable.
In order to keep the setup simple, we will use Docker.
Elastic provides a docker-compose file on its website.
The one used here is strongly inspired but with slight modifications.
Warning: In the .env file, the path referenced in the variable DATA_PATH must be accessible to the user running Docker on your system, especially if your system is a Linux one
Once the .env file has been updated to match your need, you can run a
docker compose up -d
When it’s running, you can perform two checks
First, in the commande line, with a curl command
curl -k -X GET "https://localhost:9200/" --user "elastic:elasticpwd"
The response must be like the following
{
"name": "es01",
  "cluster_name": "adelean-cluster",
  "cluster_uuid": "0ku-2DJrRKObuCUMT4nTfA",
  "version": {
    "number": "8.11.3",
    "build_flavor": "default",
    "build_type": "docker",
    "build_hash": "64cf052f3b56b1fd4449f5454cb88aca7e739d9a",
    "build_date": "2023-12-08T11:33:53.634979452Z",
    "build_snapshot": false,
    "lucene_version": "9.8.0",
    "minimum_wire_compatibility_version": "7.17.0",
    "minimum_index_compatibility_version": "7.0.0"
  },
  "tagline": "You Know, for Search"
}
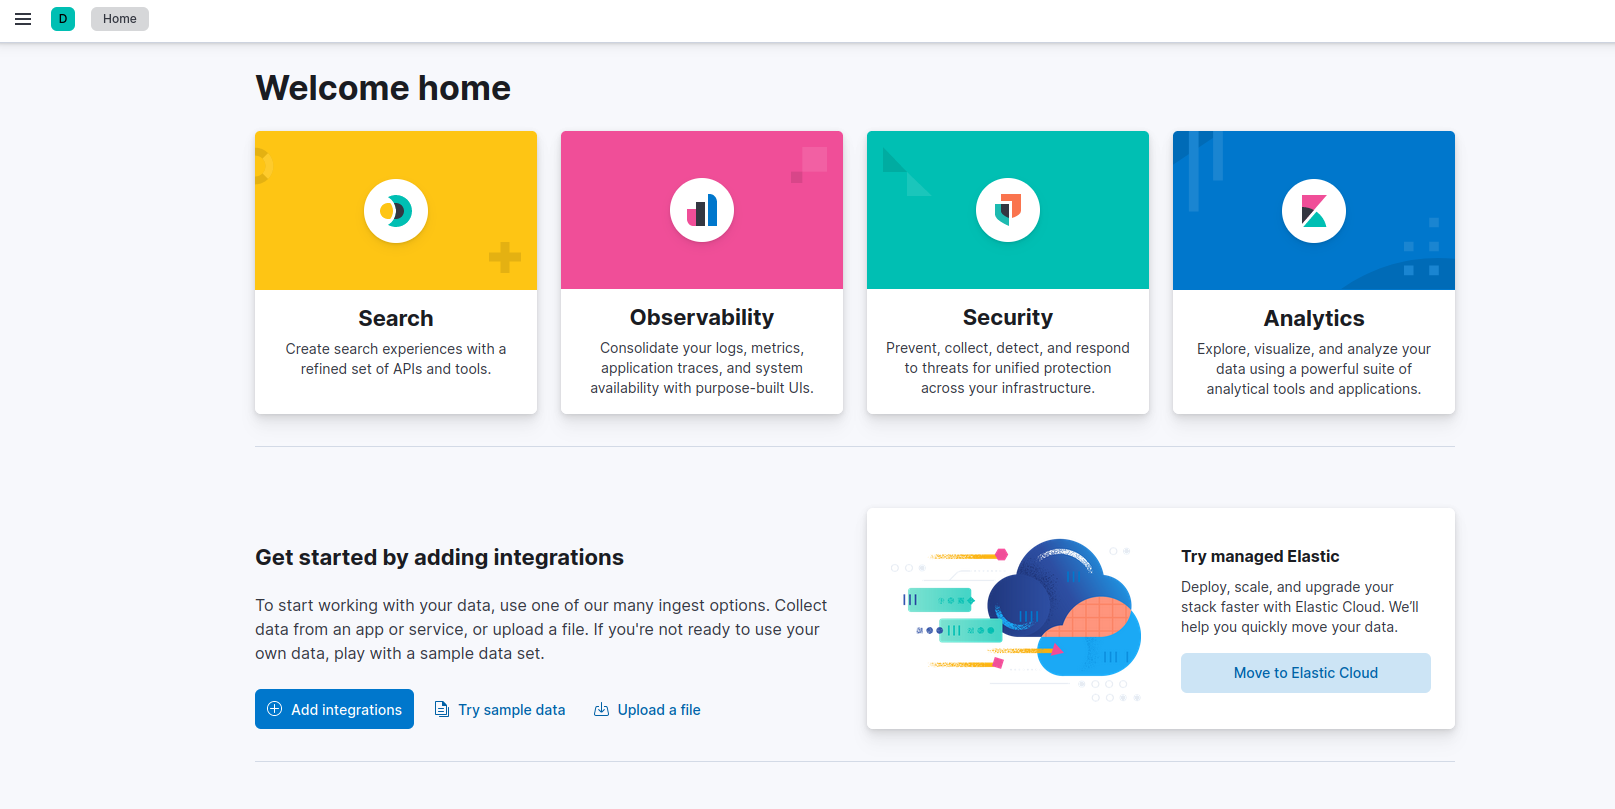
Then connecting to Kibana with the URL http://localhost:5601 which will display the login page.
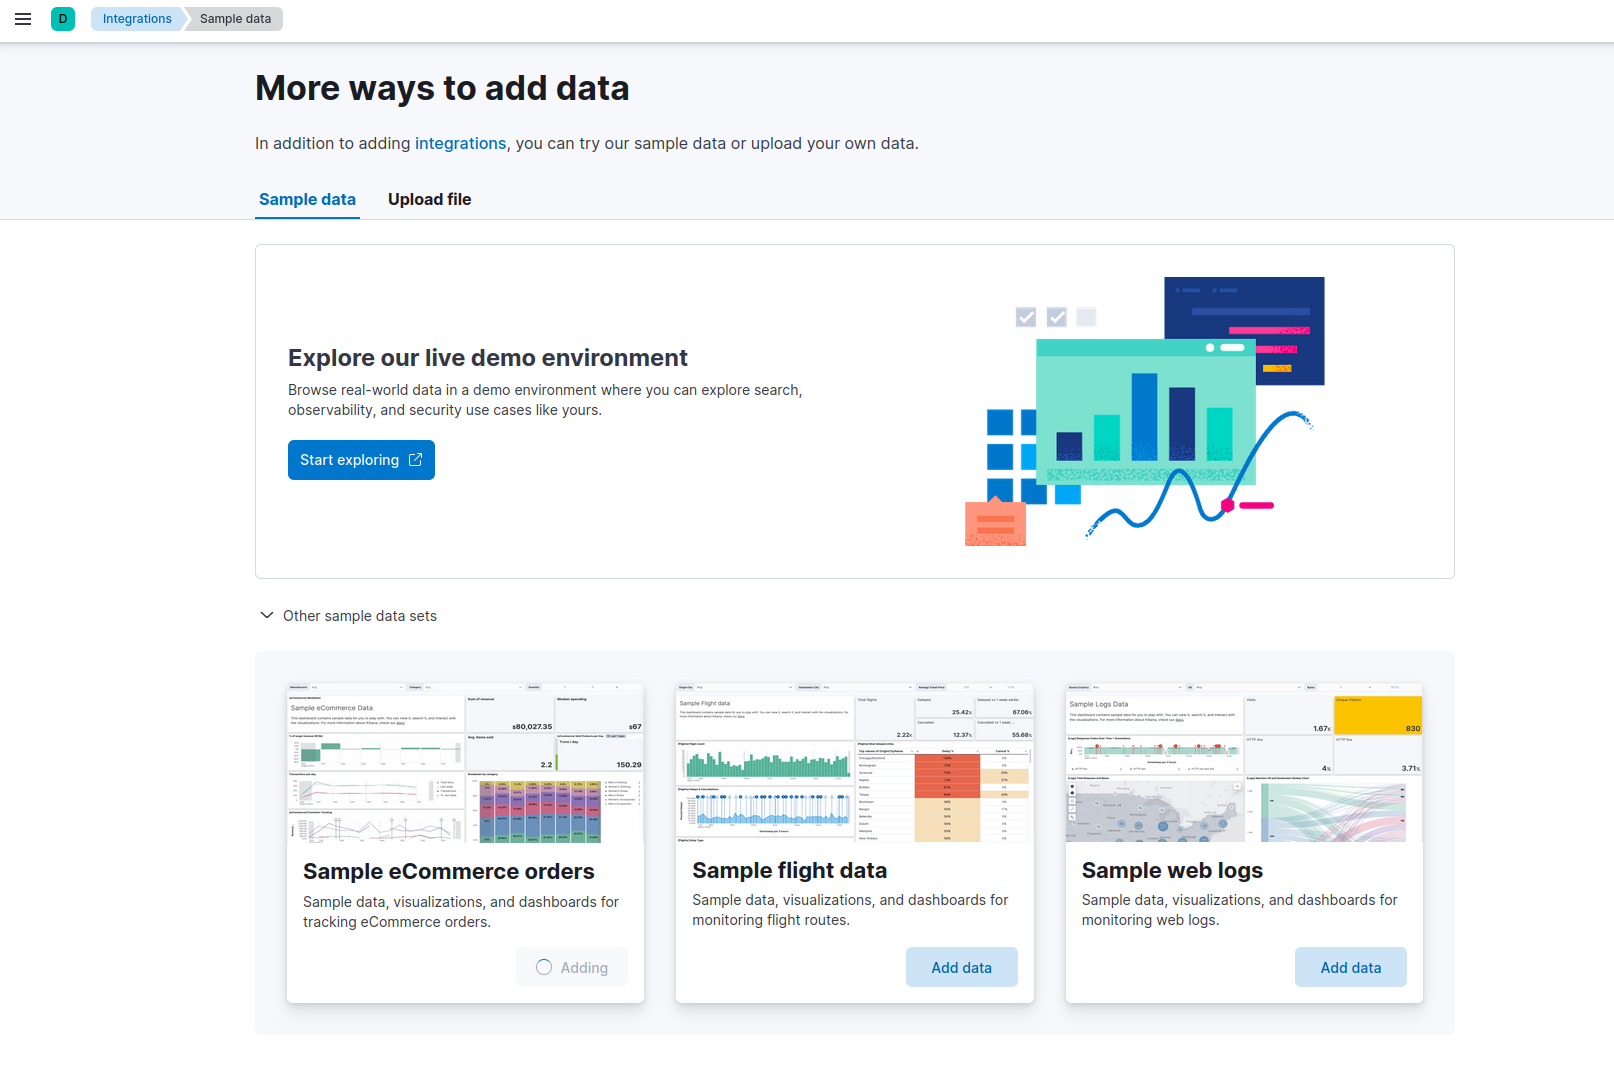
Once authenticated with the user “elastic”, the home page will display many options. One of them is trying sample data.
On the data set choice, a “Other sample data sets” menu will allow us to choose “Sample eCommerce orders” by clicking on the “Add data” button.
We will go on a Maven project with Java 21 and Spring Boot 3.2.
To avoid getting distracted by creating a UI, we will utilize unit testing to initiate the requests.
The POM file will look like this
<?xml version="1.0" encoding="UTF-8"?>
<project xmlns="http://maven.apache.org/POM/4.0.0" xmlns:xsi="http://www.w3.org/2001/XMLSchema-instance"
         xsi:schemaLocation="http://maven.apache.org/POM/4.0.0 https://maven.apache.org/xsd/maven-4.0.0.xsd">
    <modelVersion>4.0.0</modelVersion>
    <parent>
        <groupId>org.springframework.boot</groupId>
        <artifactId>spring-boot-starter-parent</artifactId>
        <version>3.2.0</version>
        <relativePath/> <!-- lookup parent from repository -->
    </parent>
    <groupId>com.adelean</groupId>
    <artifactId>dev-elastic-01</artifactId>
    <version>0.0.1-SNAPSHOT</version>
    <name>01-dev-elastic</name>
    <description>01-dev-elastic</description>
    <properties>
        <java.version>21</java.version>
    </properties>
    <dependencies>
        <dependency>
            <groupId>org.springframework.boot</groupId>
            <artifactId>spring-boot-starter</artifactId>
        </dependency>

        <dependency>
            <groupId>org.springframework.boot</groupId>
            <artifactId>spring-boot-starter-test</artifactId>
            <scope>test</scope>
        </dependency>

        <dependency>
            <groupId>co.elastic.clients</groupId>
            <artifactId>elasticsearch-java</artifactId>
            <version>8.11.2</version>
        </dependency>

        <dependency>
            <groupId>com.fasterxml.jackson.core</groupId>
            <artifactId>jackson-databind</artifactId>
            <version>2.12.7.1</version>
        </dependency>

    </dependencies>

    <build>
        <plugins>
            <plugin>
                <groupId>org.springframework.boot</groupId>
                <artifactId>spring-boot-maven-plugin</artifactId>
            </plugin>
        </plugins>
    </build>
</project>
To establish the connection, we must use the java client developped by Elastic.
But, as we are working with a cluser using SSL, we will need to use the certificates?
In the folder matching the PATH_DATA variable in the .env file, we can see that new folders were created.
The certificate we want is in $PATH_DATA/certs/ca/ca.crt
We need its fingerprint and we can get it in two different ways.
The first one is by looking at the logs of a node on the first start.
The second one is by running the following line:
openssl s_client -connect localhost:9200 -servername localhost -showcerts </dev/null 2>/dev/null \
  | openssl x509 -fingerprint -sha256 -noout -in /dev/stdin
In the java project, in src/main/resources, we will add some data to the application.properties file:
elastic.host=localhost
elastic.port=9200
elastic.ca.fingerprint=<previously obtained fingerprint>
Once done, we can create a service class which will instantiate the client and use it.
package com.adelean.develastic01.services.supervision;

/* imports*/

@Service("IndicesService")
public class Indices {

    @Value("${elastic.host}")
    private String elasticHost;

    @Value("${elastic.port}")
    private int elasticPort;

    @Value("${elastic.ca.fingerprint}")
    private String fingerPrint;

    @Value("${elastic.user}")
    private String elasticUser;

    @Value("${elastic.password}")
    private String elasticPassword;

    private ElasticsearchClient getClient() {

        SSLContext sslContext = TransportUtils.sslContextFromCaFingerprint(fingerPrint);
        BasicCredentialsProvider credsProv = new BasicCredentialsProvider();
        credsProv.setCredentials(AuthScope.ANY, new UsernamePasswordCredentials(elasticUser, elasticPassword));

        RestClient restClient = RestClient
                .builder(new HttpHost(elasticHost, elasticPort, "https"))
                .setHttpClientConfigCallback( ccb -> ccb.setSSLContext(sslContext).setDefaultCredentialsProvider(credsProv))
                .build();

        ElasticsearchTransport transport = new RestClientTransport(restClient, new JacksonJsonpMapper());

        return new ElasticsearchClient(transport);

    }

}
The TransportUtils class is a utility class that allows us to et a SSL context from a certificate fingerprint or from a certificate itself
The first request will allow us to get the list of all the indexes stored in the cluster
public Set<String> listIndices() {

    GetIndexRequest request = new GetIndexRequest.Builder().index("*").build();

    try {
        GetIndexResponse response = getClient().indices().get(request);
        Map<String, IndexState> indices = response.result();

        return indices.keySet();

    } catch (IOException e) {
        throw new RuntimeException(e);
    }

}
Once done, all we have to do is to create a test class to check what this first request is getting as a result.
package com.adelean.develastic01.services.supervision;

/* imports */

@SpringBootTest
class IndicesTest {

    @Autowired
    private Indices indicesService;

    @Test
    void listAllIndices() {

        var result = indicesService.listIndices();

        assertTrue(result.size() > 1);

    }

}
The index list will look like:
In this list, we can find kibana_sample_data_ecommerce.
In the Kibana console, which can be accessed trhough “Management” -> “Dev Tools”, the matching request would be:
GET _cat/indices
In the next article, we will see how to enhance this code and run other requests.